
Mastering Infrastructure Diagrams with Draw.io MCP
On February 3, 2026, JGraph, the team behind draw.io, released their official Model Context Protocol (MCP) server: @drawio/mcp. This release bridges the gap between AI agents and professional-grade visual documentation, enabling developers to generate editable, high-quality diagrams directly from their codebase.
In this guide, I'll share how I leveraged this new tool to automate Google Cloud Platform (GCP) infrastructure diagrams, moving beyond basic flowcharts to create standardized, architectural-grade visuals.
The Problem with Manual Diagramming
As developers, we know the struggle: documentation is often the last thing we do, and it becomes outdated the moment we commit new code. Manually dragging and dropping shapes in a separate tool breaks our flow. We need a way to keep our visual documentation as agile as our code.
The Vision: An AI-Driven Diagramming Tool
I didn't just want an image generator; I wanted a tool that could integrate deeply with my development workflow. My requirements were specific:
- Core Capabilities: Create AI-generated diagrams of existing apps and screen flows directly from the codebase.
- Visuals: Support for animations, custom assets (like Company Logos), and shared libraries to maintain brand consistency.
- Technical Approach: Focus on XML. I needed full post-generation human control over complex layouts (tight grids, specific shapes) which image generation models simply cannot provide.
- Integration: Seamless workflow with my AI coding assistant, Antigravity, to either document existing code or plan new features visually.
Why Not Mermaid?
Mermaid.js has been the go-to for code-based diagrams, but for my use cases, it fell short:
- Personal Preference for Quality: Frankly, Mermaid diagrams often lack the polish needed for non-engineering audiences (stakeholders, PMs, clients).
- Layout Control: Mermaid's algorithmic layout can be rigid and unpredictable ("buggy" when forced into complex structures), whereas Draw.io's XML format allows for pixel-perfect positioning with a further human touchs so I always have completely control using the visual editor
- Visual Impact: Native Draw.io diagrams feel more vibrant, professional, and presentable out-of-the-box.
The Solution: A Reusable "Skill"
To solve this, I created a reusable Agent Skill (create_gcp_diagram) that orchestrates the MCP server. This isn't just a prompt; it's a structured workflow.
Key Components
-
The Base Template (
template.xml): A pre-configured file containing the GCP boundary, logo, and title placeholders. This ensures every diagram starts with a consistent, professional layout. This is optional, but recommended.to ensure a consistent look and feel across all diagrams. -
The Component Library (
GCP Share Library.drawio): Crucial: Using a custom shape library provided the most consistent results. Relying on AI to "draw a Cloud Run icon" often resulted in generic boxes or unpredictable shapes.To fix this, I created a deterministic source of truth:
1.  Opened a blank Draw.io diagram.
2.  Enabled the **Google Cloud Platform** shape library.
3.  Dragged every service icon I planned to use (Cloud Run, Firestore, etc.) onto the canvas.
4.  Exported this single page as an XML file (`GCP Share Library.drawio.xml`) and placed it in my project's `docs/` folder.
The Workflow
The automation follows a strict four-step process defined in the skill:
- Initialization: The agent loads the base template.
- Component Selection: It selects specific shapes from our shared library.
- Crucial Detail: The agent is instructed to preserve standardized dimensions (e.g.,
75x75for logos) to avoid stretching or distorting icons.
- Crucial Detail: The agent is instructed to preserve standardized dimensions (e.g.,
- Asset Composition: Elements are grouped effectively (e.g., combining a Cloud Run icon with its text label into a single container).
- Automation: The agent generates the final XML structure.
Visual Proof
Here is the result of running the skill against my mymegam repository. The agent analyzed the Dockerfile, next.config.mjs, and GitHub Actions workflows to produce this accurate representation of the deployment pipeline:
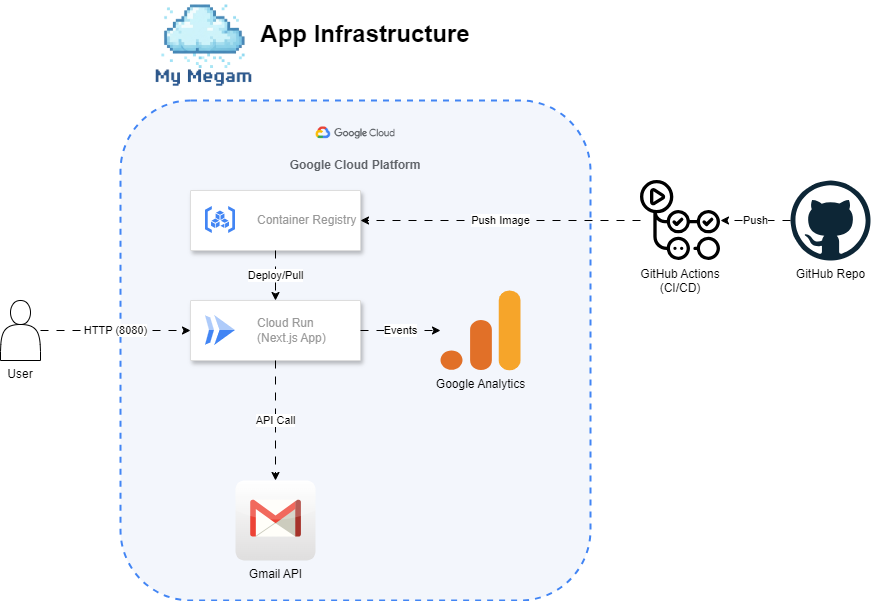
In Action
The agent generating the XML structure in real-time.
Lessons Learned & Best Practices
- File Extensions Matter: Always save as
.drawio. While it is XML under the hood, the.drawioextension ensures better compatibility with VS Code extensions and the web editor. - Dimension Locking: Explicitly instructing the agent to use
widthandheightvalues from the library is non-negotiable. Without this, AI tends to resize icons to fit text, leading to distorted shapes. - Visual Hierarchy: Use
mxCellparents (containers) to organize services. Placing Cloud Run services inside a GCP boundary box communicates architecture much more clearly than floating icons.
Summary
This experiment proves that we can elevate AI-generated documentation beyond simple flowcharts.
- Reusable Capability: We've built a "skill" that can be called upon repeatedly. Interoperability: This skill structure is portable and can be reused across other AI agents like Gemini CLI and Claude Code.
- Developer Experience: With the Draw.io VS Code extension, this integrates natively into the editor—no context switching required.
- Forward-Looking Use Cases:
- Planning: Sketching new features visually before writing code.
- Evolution: Since the output is standard Draw.io XML, we can easily edit and evolve these diagrams as the system grows.
- The Human Touch: AI gets us 80-90% of the way there. A truly great diagram always benefits from human review and refinement. This tool gives us a solid base to build upon, saving hours of initial drafting time.
Resources & References
Want to implement this in your own workflow?
-
Official MCP Server Setup: Draw.io MCP Tool Server Guide - Official instructions on how to install and configure the
@drawio/mcpserver. -
Full Skill Definition:
---
name: create_gcp_diagram
description: Create professional Google Cloud Platform (GCP) infrastructure diagrams using standardized shapes, layouts, and animations.
---

# Create GCP Infrastructure Diagram

Follow these instructions to create standardized and professional GCP architecture diagrams.

## Prerequisites

-   Access to `.agent/skills/create_gcp_diagram/resources/template.xml` (Base template).
-   Access to `docs/GCP Share Library.drawio.xml` (Component library).

## Procedure

### 1. Initialize Diagram

Start by loading the base template which includes the GCP boundary, logo, and title placeholders.

-   **Template Path**: `.agent/skills/create_gcp_diagram/resources/template.xml`
-   **Action**: Read the template content.
-   **Update Title**: Look for the `mxCell` with id `200` (Title/Description). Update the HTML content:
    -   `<h1>[Your Diagram Title]</h1>`: Replace with a clear, concise title (e.g., "MyMegam App Infrastructure").
    -   `<p>[Description]</p>`: Replace with a brief overview of the architecture.

### 2. Add Components

Populate the diagram with necessary infrastructure components.

-   **Source**: Check `docs/GCP Share Library.drawio.xml` for pre-styled components (e.g., Cloud Run, Container Registry). Use the `image` style data from these components.
    -   **Dimensions**: **CRITICAL**: Use the exact `width` and `height` values from the library components. Do not stretch or resize them arbitrarily, as this distorts the icons. If a component is a group, reproduce the group structure.
-   **Placement**:
    -   **GCP Services**: Place all Google Cloud services (Cloud Run, Firestore, etc.) **inside** the blue boundary box (`id="100"`).
    -   **External Actors**: Place users, external repositories (GitHub), and third-party services **outside** the boundary box.
-   **Styling**:
    -   Use `strokeColor=#dddddd` and `fillColor=#FFFFFF` for standard component boxes unless specified otherwise.
    -   Ensure icons are vertically aligned and labelled clearly.

### 3. Connect Components

Define the flow of data or processes between components.

-   **Connectors**: Use `edgeStyle=orthogonalEdgeStyle` for clean, right-angled lines.
-   **Animation**: Enable flow animation on all active data paths by adding `flowAnimation=1` to the style string of the `mxCell` (edge).
-   **Labels**: Label edges with protocols (e.g., "HTTP", "gRPC") or actions (e.g., "Push", "Deploy").

### 4. Finalize Layout

-   **Alignment**: Ensure the GCP Logo (`id="101"`) and Title (`id="102"`) remain centered at the top of the boundary.
-   **Boundary**: The boundary (`id="100"`) should have:
    -   `fillColor=#F3F6FC` (Light Blue/Gray background).
    -   `strokeColor=#4285F4` (Google Blue stroke).
    -   `dashed=1` or `dashed=0` (consistent usage).
-   **Spacing**: Maintain consistent padding around components within the boundary.

### 5. Save Output

-   **Format**: Save the final XML content with a `.drawio` extension (not `.xml` or `.drawio.xml`).
-   **Path**: Typically save to `docs/` or a user-specified location.

## Example XML Snippet (Style Reference)

\`\`\`xml
<!-- Boundary Style -->
<mxCell id="100" value="" style="rounded=1;whiteSpace=wrap;html=1;fillColor=#F3F6FC;strokeColor=#4285F4;strokeWidth=2;dashed=1;verticalAlign=top;align=left;spacingTop=10;spacingLeft=10;" vertex="1" parent="1">
  <mxGeometry x="180" y="20" width="470" height="500" as="geometry"/>
</mxCell>

<!-- Animated Edge Style -->
<mxCell id="edge1" value="Data Flow" style="edgeStyle=orthogonalEdgeStyle;rounded=0;orthogonalLoop=1;jettySize=auto;html=1;flowAnimation=1;" edge="1" parent="1" source="2" target="3">
  <mxGeometry relative="1" as="geometry"/>
</mxCell>
\`\`\`